

Even as services become emerging markets’ new shock absorber, according to S&P Global, and as increasingly evident in the role of this sector in cushioning the impact of US tariffs on India’s exports, India, as a global leader in technology services in the region, has the potential to assist in other developing and least developed member states (LDCs) to develop both legal and technology processes for paperless trade and to implement cross-border paperless trade.
Several Indian start-ups offer niche services, in addition to products, supporting paperless trade. Indian IT companies can secure business by developing systems for member states of the Framework Agreement on Cross-Border Paperless Trade in Asia and the Pacific (CPTA).
In fact, as a study report on India and CPTA unveiled on Monday suggests, if India can offer lower trade costs supported by measures such as paperless trade, ensuring smoother cross-border flows of goods and services, it will gain a competitive edge to become part of global value chains (GVCs).
Paperless trade reduces transaction costs and can be a game changer for India, suggests the report by the Indian Council for Research on International Economic Relations (ICRIER) and the Research and Information System for Developing Countries (RIS).
The report comes at a time when global trade is becoming increasingly fragmented and exposed to geopolitical tensions and protectionism. Services balances have gained strategic importance for emerging markets, according to S&P Global Ratings.
India is a stellar example, with services contributing over half of India’s gross value added (GVA), reflecting their role in output, employment, investment and exports. This echoes the global rating agency’s view that while services trade will not fully shield emerging markets from disruptions in goods trade, it can act as a buffer against shocks.
Boom In Services Exports
Reinforcing this trend, in September, amid India’s total trade deficit of USD 16.61 billion driven by a sharp rise in overall imports to USD 83.82 billion from USD 75.28 billion and slower growth in India’s overall exports, which rose to USD 67.20 billion in September 2025, the resilience of the services sector continues to provide balance and stability, notes Federation of Indian Export Organisations (FIEO) president SC Ralhan.
Similarly, for the April–September 2025 period, overall exports (goods and services combined) increased by 4.45 per cent to USD 395.71 billion, while total imports grew by 3.55 per cent to USD 472.79 billion. Ralhan sees the narrowing of the overall trade deficit by 2.28 per cent to USD 59.48 billion as a positive development, again reflecting the continued strength of India’s services exports alongside improving trade dynamics. In August, too, services exports grew to USD 34.06 billion compared to USD 30.36 billion in August 2024. Service exports during April–August 2025 showed an uptrend at USD 165.22 billion compared to USD 149.43 billion in April–August 2024.
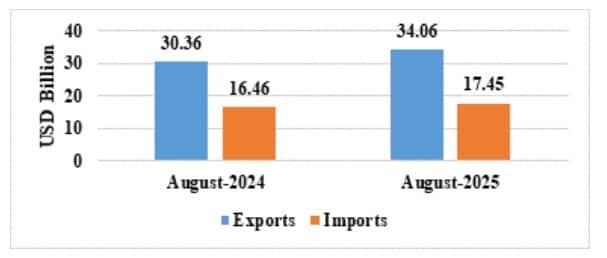
Services Trade during August 2025
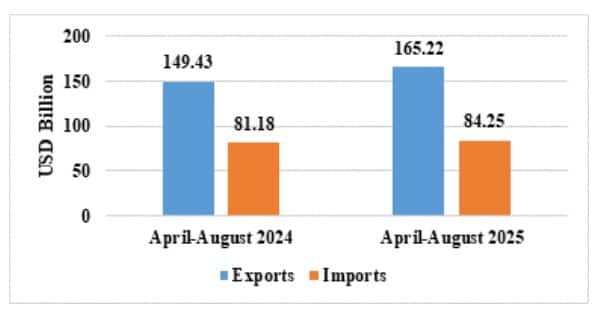
Services Trade during April-August 2025
“Services surpluses have once again surpassed goods trade balances across emerging markets, marking a structural shift that highlights the services sector’s increasing importance,” says S&P Global Ratings credit analyst Amr Abdullah, who believes that economies scaling exportable services are now structurally better placed to absorb shocks to goods trade.
The strength of India’s services economy is reinforced in the HSBC India Services PMI Business Activity Index for September, which shows operating conditions across India’s service economy remaining favourable, with healthy demand trends underpinning further growth in total new orders, exports, employment and business activity. In all four cases, however, rates of expansion eased since August.
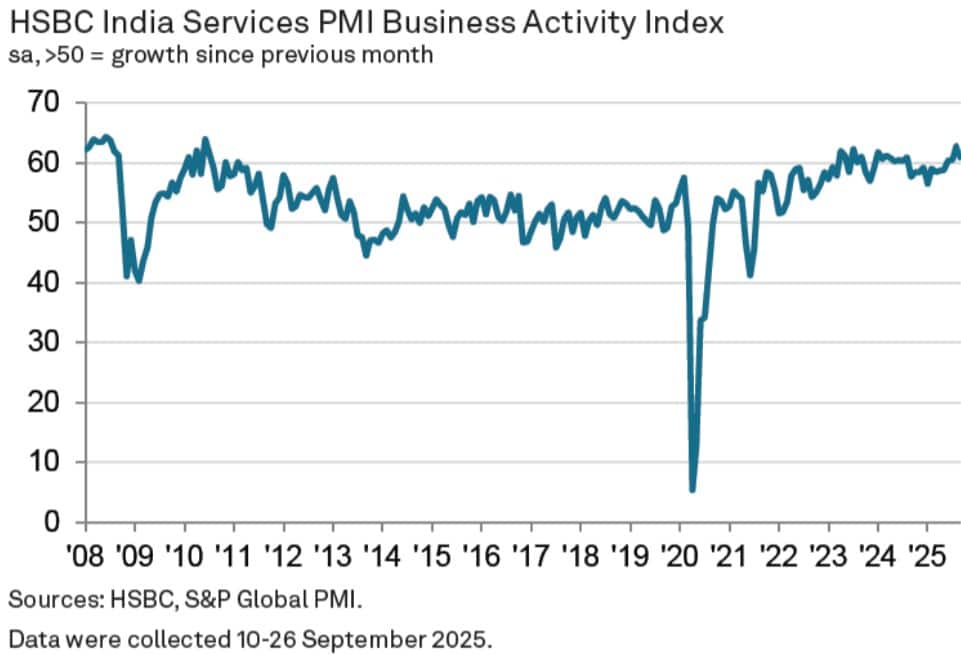
Anecdotal evidence shows that demand buoyancy and new business gains, alongside tech investment and favourable public policies, supported the rise in services output. New order intakes for Indian service companies rose at a sharp pace, though softer than in August. Underlying data indicate that part of the slowdown reflected weaker international demand for Indian services. Barriers to growth cited by panel members included competitive pressures and cost-control measures.
Pranjul Bhandari, Chief India Economist at HSBC, agrees that business activity in India’s services sector eased in September from the recent high in August and that most trackers moderated, but “nothing in the survey suggested there is a big loss in growth momentum in services.” Instead, the “Future Activity Index rose to its highest level since March, indicating strengthening optimism among services companies about business prospects,” says Bhandari.
Regional Variations In Services
The services sector has emerged as the largest and most dynamic component of the Indian economy. According to NITI Aayog experts, India’s development experience is marked by a distinctive and early transition towards growth anchored in the services sector. However, beneath this strength lies considerable heterogeneity across sub-sectors, levels of formality and regional performance.
A comparative analysis by NITI Aayog of state-wise services shares in gross state value added (GSVA) over the past decade reveals a marked increase in the relative contribution of the services sector across many Indian states and UTs, though with significant regional variation. Many states remain dominated by traditional, largely informal sub-sectors such as retail trade, transport, hospitality and repair services. This reflects not only national-level structural changes but also the varied capacity of states and UTs to integrate into services-driven growth.
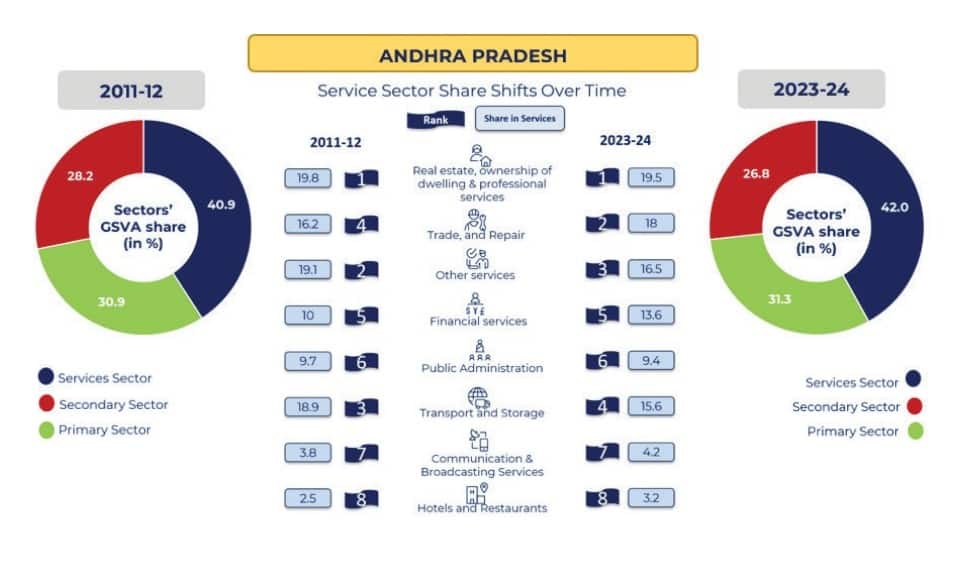
Services sub-sectors according to their ranking at the national level, based on their share in total services Gross Value Added (GVA) in 2023–24
Southern states, particularly Karnataka, Kerala, Tamil Nadu and Telangana, have emerged as the major service-intensive economies. Karnataka’s share rose from 56.8 per cent to 65.9 per cent; Kerala from 57.5 per cent to 64.3 per cent; Tamil Nadu from 50.5 per cent to 51.7 per cent; and Telangana from 52.8 per cent to 62.4 per cent. This transformation is driven by the continuous expansion of high-value services such as IT, financial services and knowledge-based industries, supported by high-performing hubs like Bengaluru, Chennai and Hyderabad.
Karnataka leads with deep specialisation in IT and digital services; Telangana with rapid structural transformation driven by innovation hubs and tech exports; and Tamil Nadu with a diversified urban services base across finance, healthcare and logistics. Kerala, by contrast, anchors its growth in trade, tourism, real estate and financial intermediation.
Similarly, Maharashtra presents a parallel case, where the services sector’s share in GSVA has increased from 51.1 per cent to 59.5 per cent, reflecting a structural shift led by the dominance of Mumbai and Pune. These centres serve as strategic hubs for high-growth services such as finance, IT, logistics and media. Mumbai accounts for nearly 24 per cent of India’s financial services GVA, reinforcing its role as the country’s financial capital, while Pune contributes significantly through a strong base of IT parks and skilled talent.
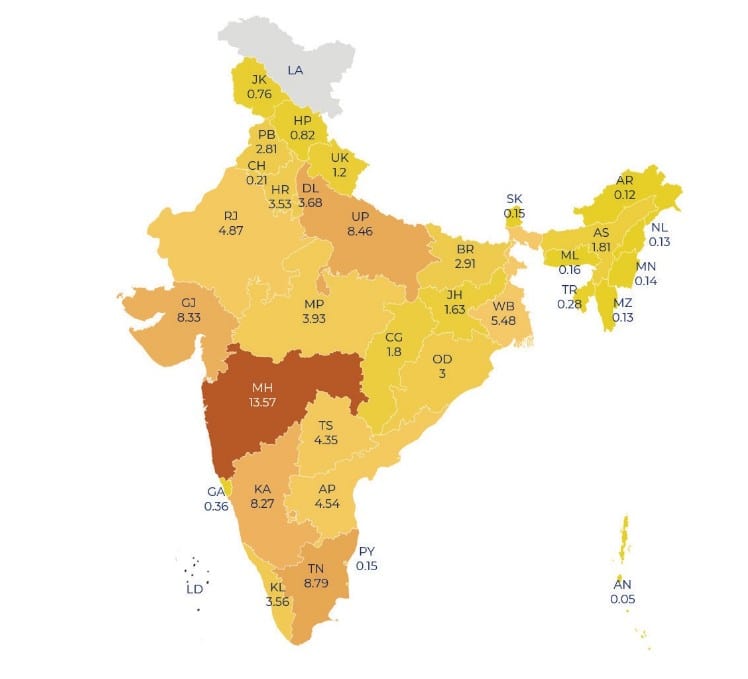
State-wise Shares in National Sectoral GVA (2023-2024)
Eastern States Low On Services Growth
At the other end of the spectrum, states like Odisha and Assam reflect a decline in their services’ GSVA share, indicating limited transition away from agriculture and extractive industries. Odisha’s services share declined from 38.5 per cent to 34.9 per cent, while Assam fell sharply from 46.5 per cent to 34.3 per cent, signalling possible underperformance in services growth.
Meanwhile, northeastern states such as Meghalaya, Manipur and Nagaland have shown gains in their services share, driven largely by the expansion of public services, health, education and infrastructure investments under central schemes. For instance, Meghalaya’s rise from 44.7 per cent to 63.2 per cent and Manipur’s increase from 64.8 per cent to 72 per cent mirror the power of state-level policy shifts and public sector-led growth in transforming service output even in geographically constrained economies.
Northern states display a more uneven trend. Delhi remains a consistent outlier, with the services share rising from 83.4 per cent to 85.5 per cent due to its dense urban economy and growing dominance in public administration, retail, real estate and professional services. Uttar Pradesh has moved from 45.5 per cent to 47.9 per cent, reflecting modest progress and highlighting potential in urban service delivery, digital public infrastructure and SME integration.
Western and central Indian states such as Gujarat, Chhattisgarh and Madhya Pradesh continue to show relatively lower levels of services-sector share. These trends point to the ongoing dominance of manufacturing, mining and resource-based sectors in these regions and the gradual diffusion of modern services. Union Territories and smaller states, including Andaman & Nicobar Islands and Chandigarh, remain highly service-oriented economies, with the services share reaching 70.3 per cent in Andaman & Nicobar Islands and 90.3 per cent in Chandigarh in 2023–24.
(Mukherjee is a contributing writer for ABP Live English. A business journalist for more than 15 years, she has written extensively on the economy, policy, and international relations in Indian newspapers and magazines)
