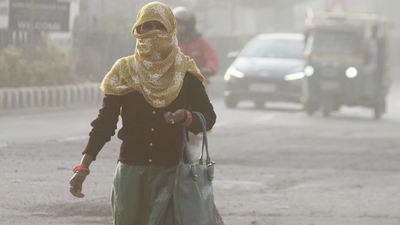
NEW DELHI: As a grey blanket of smog smothered the city and Delhiites struggled to breathe, air pollution data went missing for a major portion of Monday. Since 1 pm, neither hourly air quality index (AQI) updates nor the city’s daily average had been released till late evening, even as the air visibly worsened since the afternoon.While hourly AQI data for individual stations was back on the Central Pollution Control Board website around 9pm, there were gaps in readings at several monitors. There was no response from CPCB or the Commission for Air Quality Management (CAQM) to TOI’s queries on the data outage.As per an independent analysis, the average PM2.5 concentration from 12am to 9pm on Monday was 249 micrograms per cubic metre as compared to 215 micrograms per cubic metre over the same period of the previous day. Based on these readings, the PM2.5 levels were near severe on Monday.Till early afternoon, when the last available readings were published, the city’s average PM2.5 levels – the primary pollutant responsible for Delhi’s foul air – were nearly identical to those recorded at the same time on Sunday. Yet, the corresponding AQI values were significantly higher, mirroring the palpable deterioration that residents could feel. By evening, visibility had dropped sharply and an acrid stench hung in the air. Roads and flyovers disappeared into a yellow-grey haze as people covered their faces and hurried indoors.”The CPCB has not updated any data since the afternoon and it’s not the first time this has happened in the last two years. The data missing from such a crucial website at such a critical time, handicaps citizens, researchers and regulators in taking action to reduce pollution or initiate precautionary measures,” said Sunil Dahiya, founder and lead analyst, Envirocatalysts.From 1pm onwards, data went missing from the CPCB website but was available on the DPCC portal. This indicated that the monitors were working and the glitch was elsewhere.By around 5.30pm, out of 562 stations across India, only 4 were live.Gurgaon’s AQI ‘cover story’: Trees, walls & missing dataA thick smokescreen hung over the city till late Monday morning. It was much the same in Delhi, Noida and other parts of NCR. But while Delhi’s AQI was 345 (very poor) and Noida’s 318 (very poor), Gurgaon seemed to be breathing easier with an AQI of 221 (poor). What one saw didn’t fit with what the data suggested.It’s been like this through this peak pollution season, since Diwali, with Gurgaon’s average AQI mostly better than other NCR cities. Since Diwali, Gurgaon has recorded only two very poor AQI days, 16 poor days and three moderate days.Within the same airshed, this can happen sometimes because of wind direction and hyperlocal meteorological factors. But when it sustains over a period of time, one has to look more closely at the data. In fact, place recording the data. That’s what we did on Monday. It was revealing.All five continuous air monitoring stations – at Vikas Sadan, Sector 51, Teri Gram, Gwalpahari and Manesar – are close to thick foliage or near walls, violating CPCB rules that require monitors to be installed at least 20-30 metres from trees and 50 metres from major structures, in open and well-ventilated areas. The stations have also not consistently recorded PM2.5 and sulphur dioxide (SO₂) data, lowering the city’s AQI averages. Gwalpahari and Teri Gram recorded incomplete indices for several days. LED display boards at all five stations have, meanwhile, been non-functional for weeks.Over the years, vegetation within govt and institutional campuses has grown tall around these stations, trapping air and absorbing a share of pollutants before they reach the sensors. The ambience of the stations, in other words, is very different from the ambience of the road that hits you as you step out. “Vegetation grew, but the monitors’ locations stayed fixed,” an official said.An analysis of CPCB’s real-time data shows the Gwalpahari station failed to record PM2.5 levels for several hours on multiple days this month. Since AQI averages are based on available readings, missing data of PM2.5 – the pollutant most responsible for NCR’s poor air – improves the average score. At Teri Gram, SO₂ data was missing for extended periods, which means one key gaseous pollutant wasn’t factored in AQI calculations.”The stations are recording partial data and AQI looks better than it should. There are long gaps in data,” said Shubhansh Tiwari, a research associate at Centre for Science and Environment.”There is no live display, but the data is being generated every day. LED screens are unable to show data as they were shut down for several months,” Krishan Kumar, regional officer, HSPCB, told TOI. Go to Source


